DEV Showcase
Pandemic Visualization
Role
Front-end Developer
Timeline
Jan 2022
Categories
Web-based App
Stackholder
CSE Department
Let get Started

About this Project
Pandemic in general and COVID-19 in particular has affected every aspect of our lives, from our health to our economy.
As the pandemic continues to evolve, there is a growing need for accurate, up-to-date information on the spread of the virus and its impact on different regions and populations. So Visuaization is a valuable tool for anyone who wants to understand the impact of the pandemic with a comprehensive overview of the current national or worldwide situation in an easy-to-understand format.
2019 - 2022
Top 1
Google Trends
43k+
Vietnamese Deaths
6,6M+
Global Deaths
2023 - now
Variants
BF7 (China) , XBB (Vietnam),..
Endemic
Till not an endemic disease
500k+
Daily Global Deaths
-
1
Missing Information: Having to follow through the press and media is a big drawback.
-
2
Raw Data Issue: hard to handle & waste time to view the current situation. epidemic.
-
3
Situation Prediction: Pandemic makes us hesitant to make any (travel) decisions.
-
4
Virus Strains: The epidemic develops abnormally with many mutated viruses capable of vaccine resistance.
-
5
The Shortcomings: Current applications do not have diverse and well-integrated features.
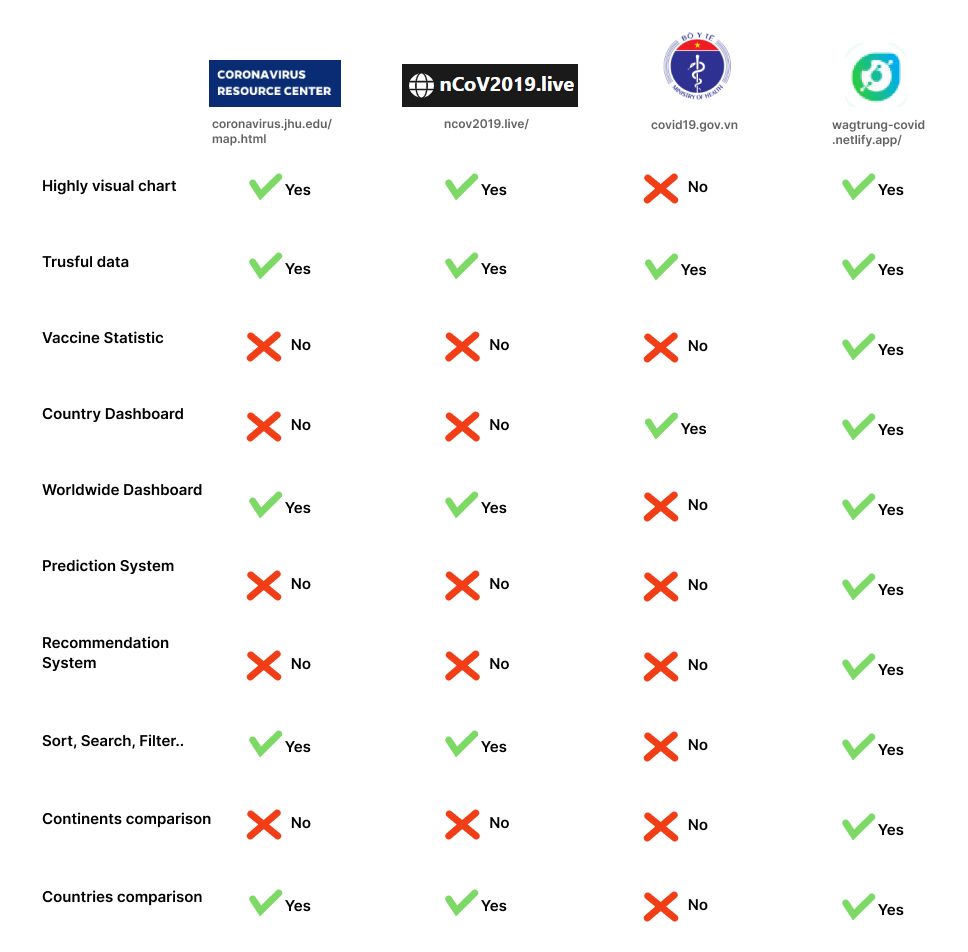
Competitors Audit
TheFeatures
Disease.sh API
Truthful Data Source
1. Reliable Mutil-Source: Crawl ing from official national sites 2. Constantly Updated: always getting the newest data as the original sources updated.
Playing with charts
View charts as you want
Make a change for a better view, this system allow users to change the chart’s criteria ( date range, disease types,…) or even download it as pdf..
Search & Sort
View a country you want
allows you to select other countries to view with a list of countries organized to your liking.
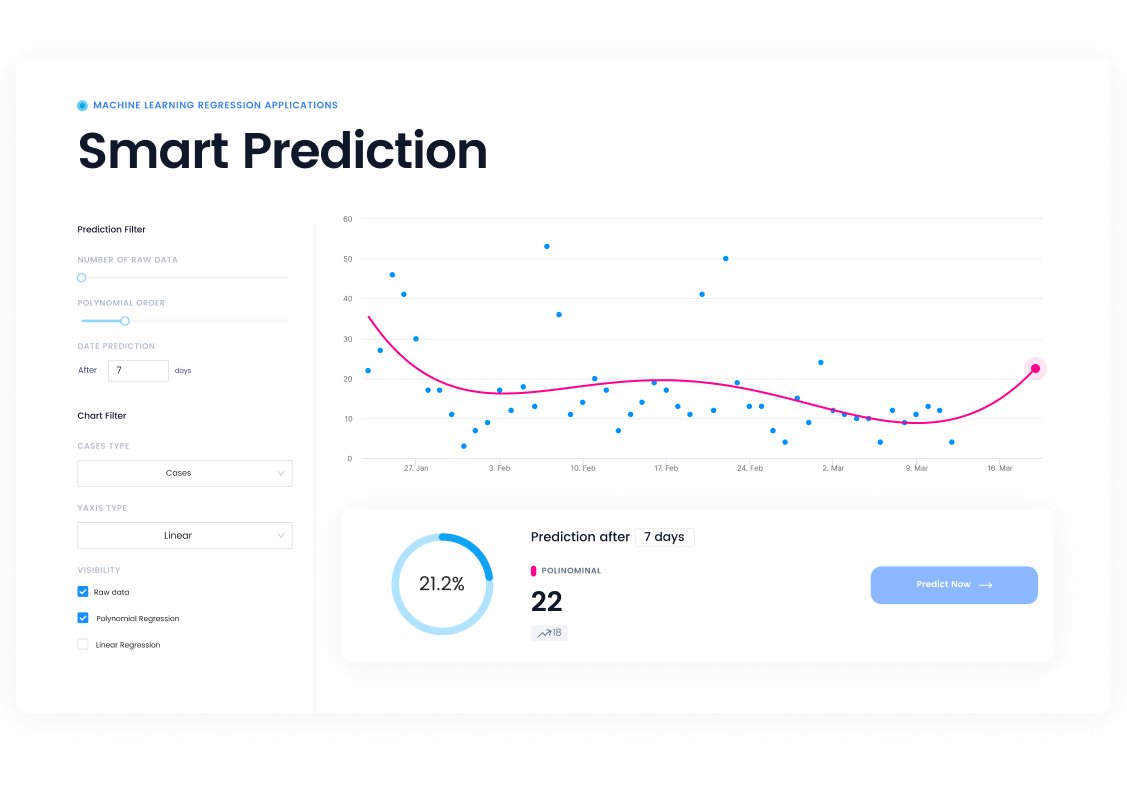
National covid-19 prediction
Scheduling without hesitation
make informed decisions about travel, health, and safety through the help of ML algorithm to predict future covid cases or deaths at any countries that you want..
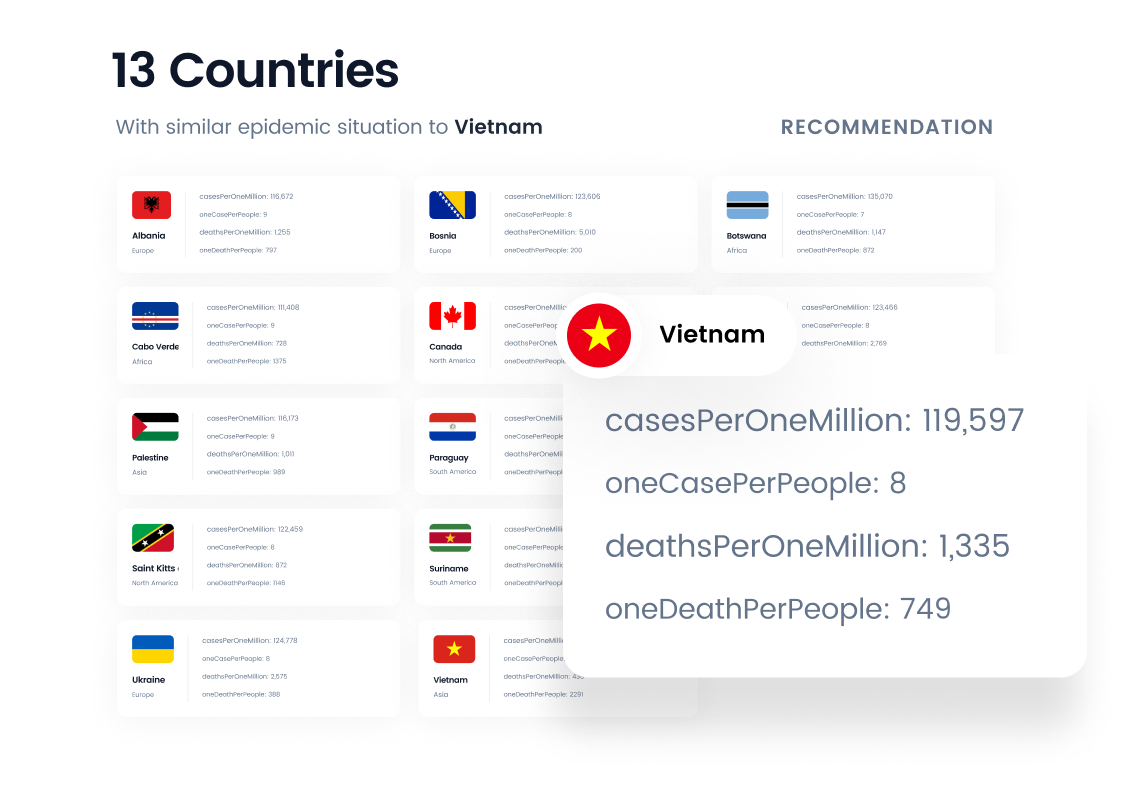
Recommendation
Control the Virus spread
Grouping countries with similar epidemic situation to the country that users are viewing for detecting the impacts of new variants.
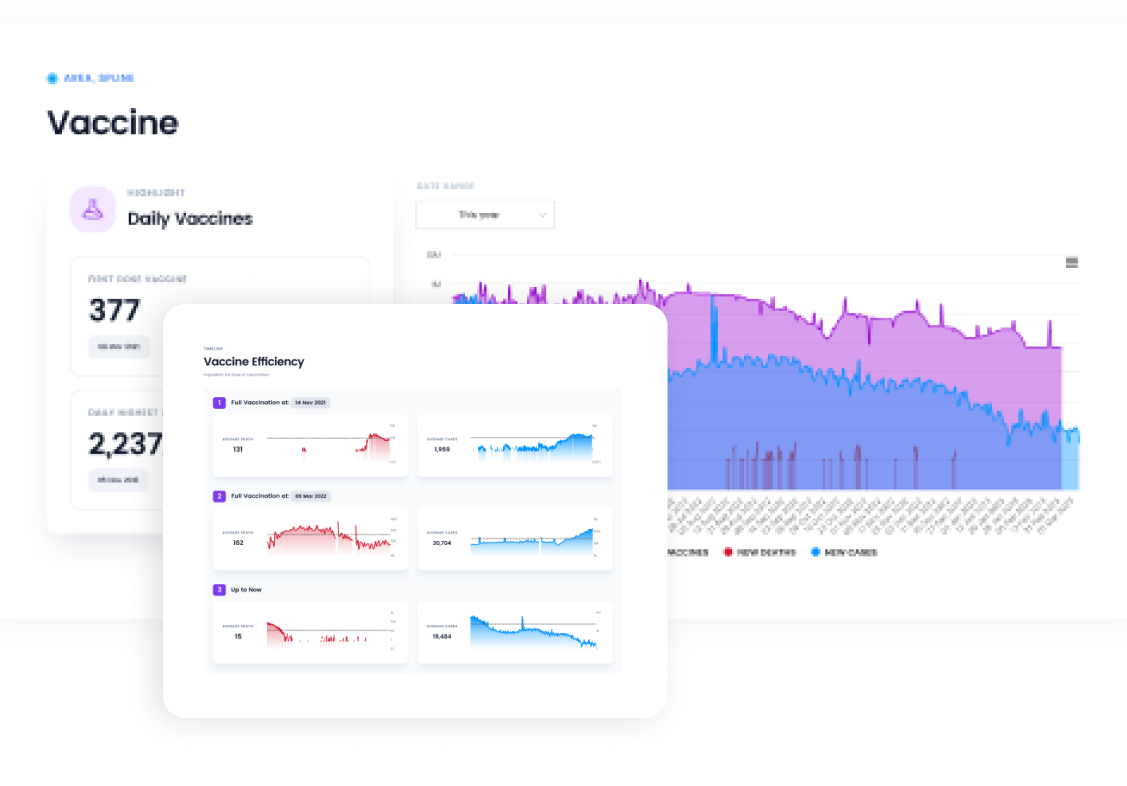
Vaccines efficiency
National Vaccine evaluation
Epidemic status of the country after vaccine coverage for the entire population.
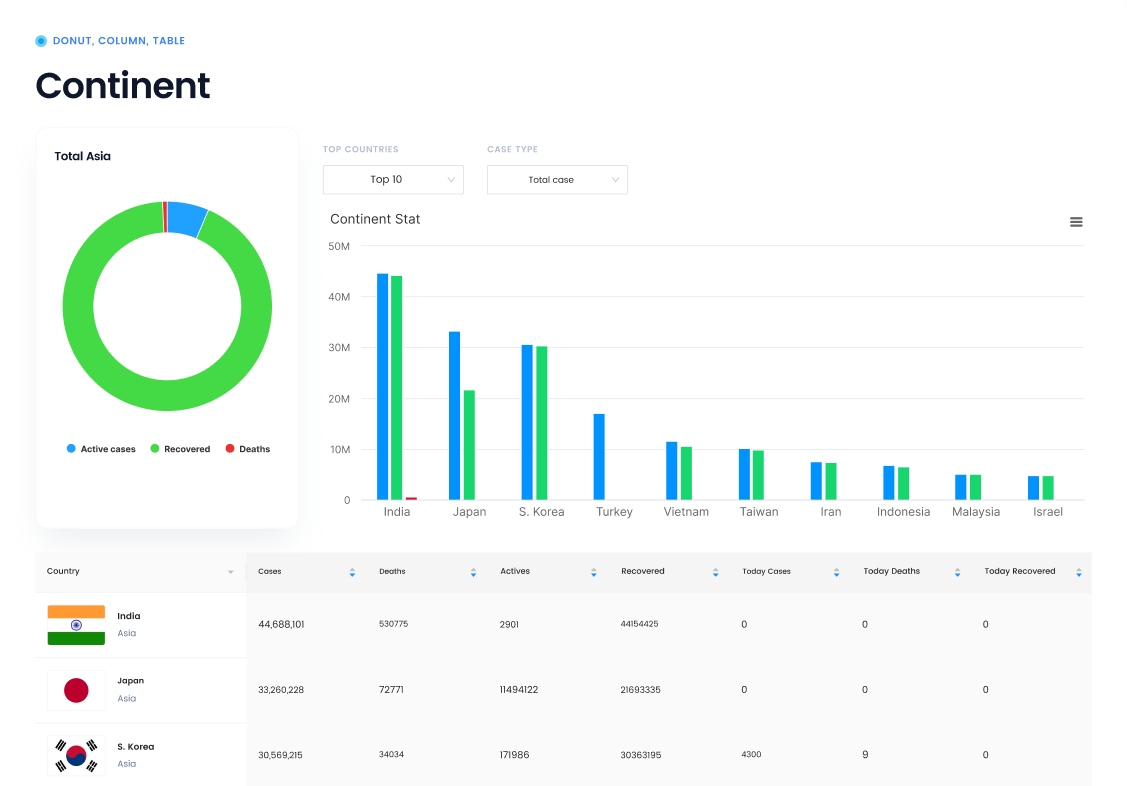
Continental comparison
countries in the same region
They can identify areas that need extra support, track the effectiveness of their policies and interventions, and communicate important information to their citizens.
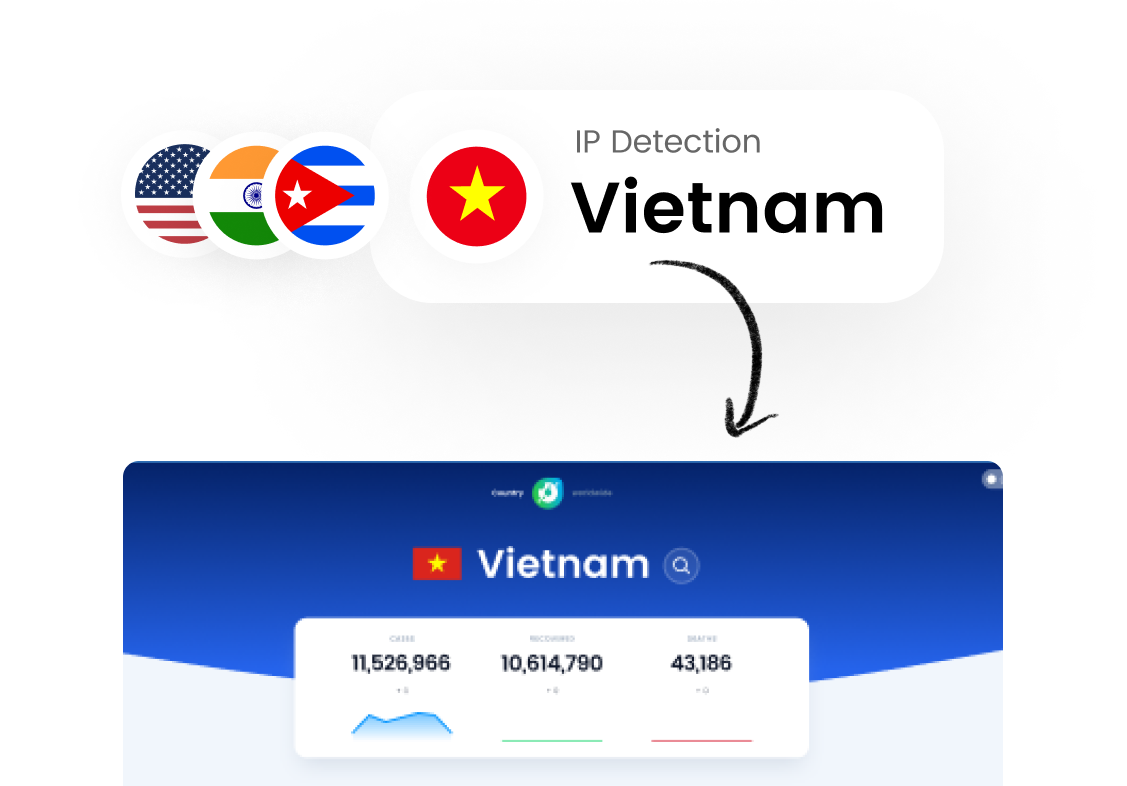
IP Detection
Your country is our priority.
Detect user IP browser for the first loading country dashboard.
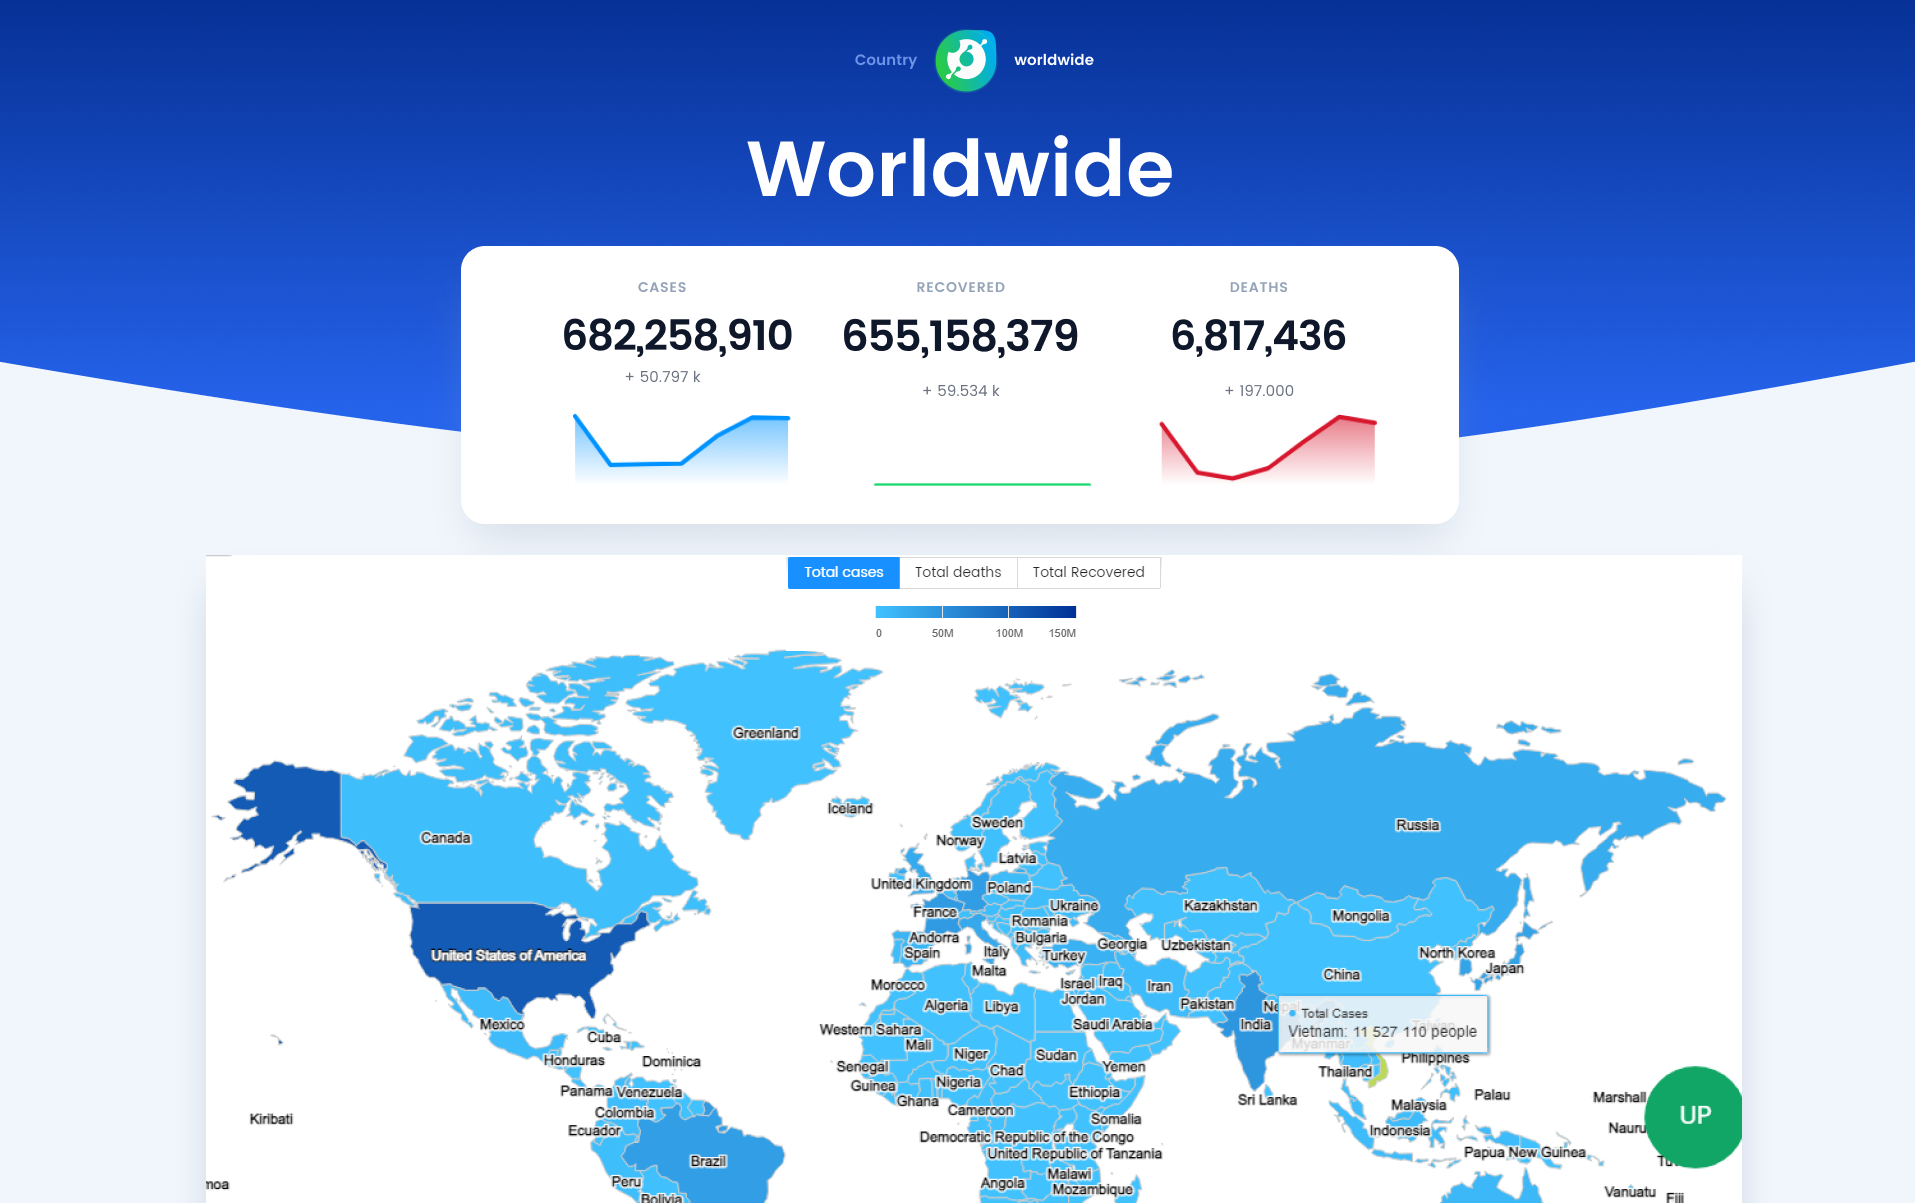
Wordwide situation
Global pandemic tracking
world map and more on epidemic status overview.
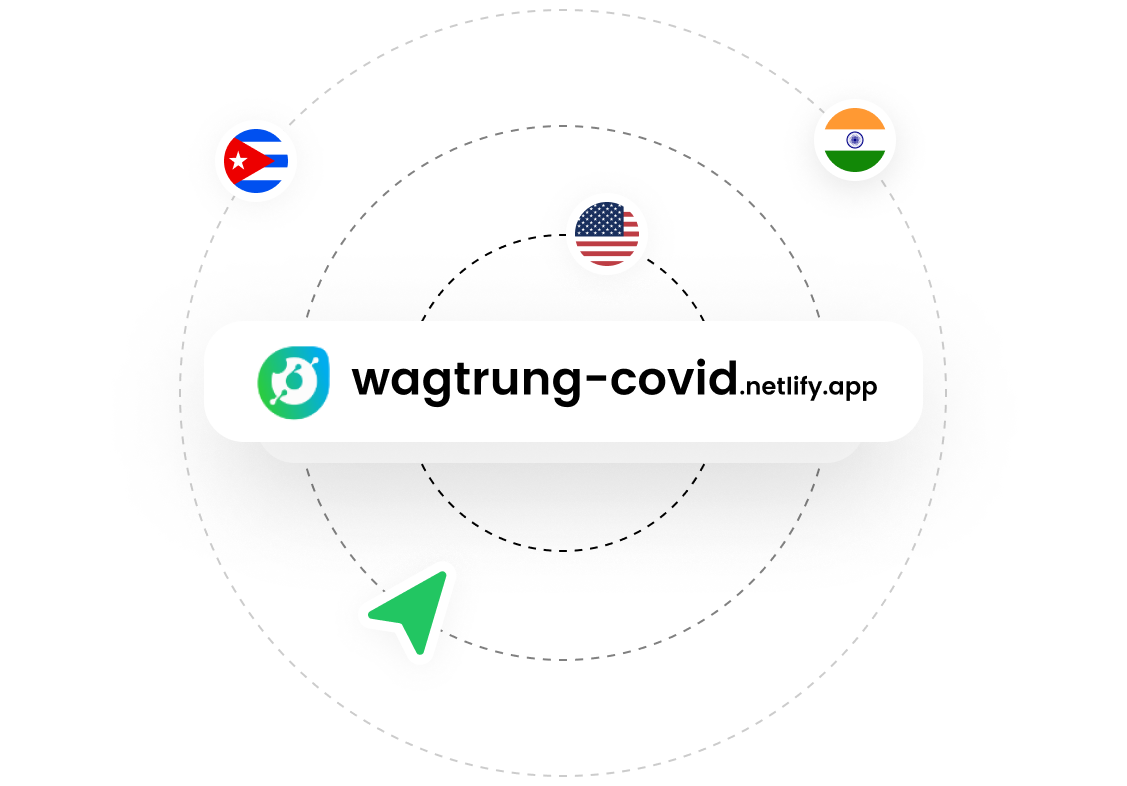
Deployment Github x Netlify
Free for online accessing
Ready to use as Web version for engaging many users..
The Process
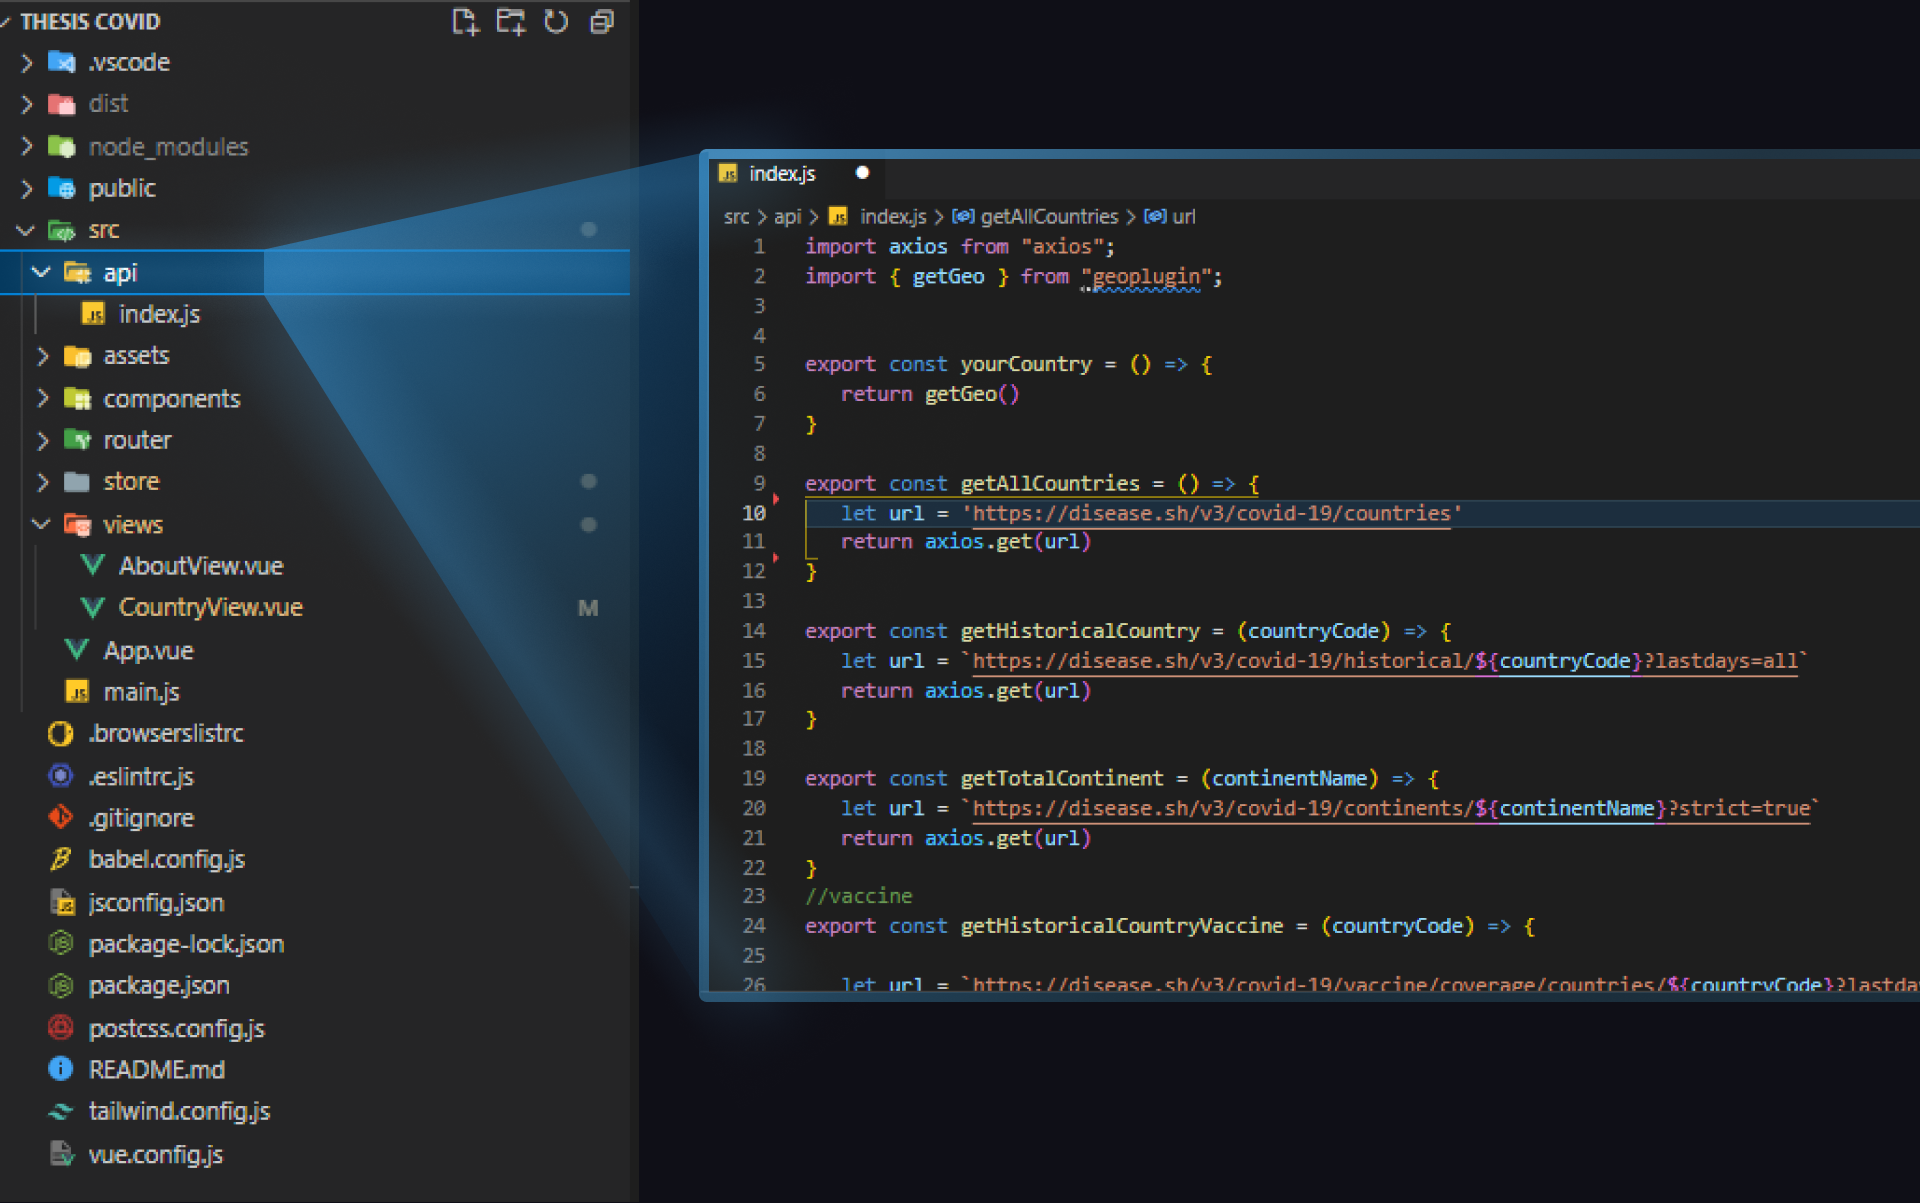
File Structure
-
1
Get all countries: getAllCountries() to get a list of countries got covid-19 pandemic.
-
2
Detect User's Country: getUserCountry() to get user country CODE (ex: VN, US,..) for the first loading in Country Dashboard.
-
3
Process & Render for a Specific Country: countryClick(CountryCode) specifies CODE to get unprocessed data for a country getForCountry(countryCode, countryContinent) from APIs.
Then the data will be processed handleGetForCountry(hisC, vacC, contiC) to fit different chart types & features.
Finally, it is rendered in View. If the user clicks to view a different country, Step (3) will be repeated by specifying that new CODE to Re-render again.
-
1
Get all countries: getAllCountries(), getTotalWorld(), getHistoricalWorld(), getTotalContinents() from disease.sh.
-
2
Process & Render for worldwide situation: Handle total global highlights, Daily statistics, Continents statistics. Then, render in view
Vue 3
Front-end Framework

Vue X
State Management
Node JS
JS environment
HighCharts
Charting Library
Ant Design
Component Framework

Axios
Fetching method
Tailwind
CSS framework
Lodash
JavaScript utility library

Numeral
Number Formatter
Moment
Date Formatter
GeoPlugin
IP Detection
Regression
ML Method for prediction
skmeans
ML Method for Clustering
Evaluation
The overall achievement
1
Member
6
Months
10+
Features
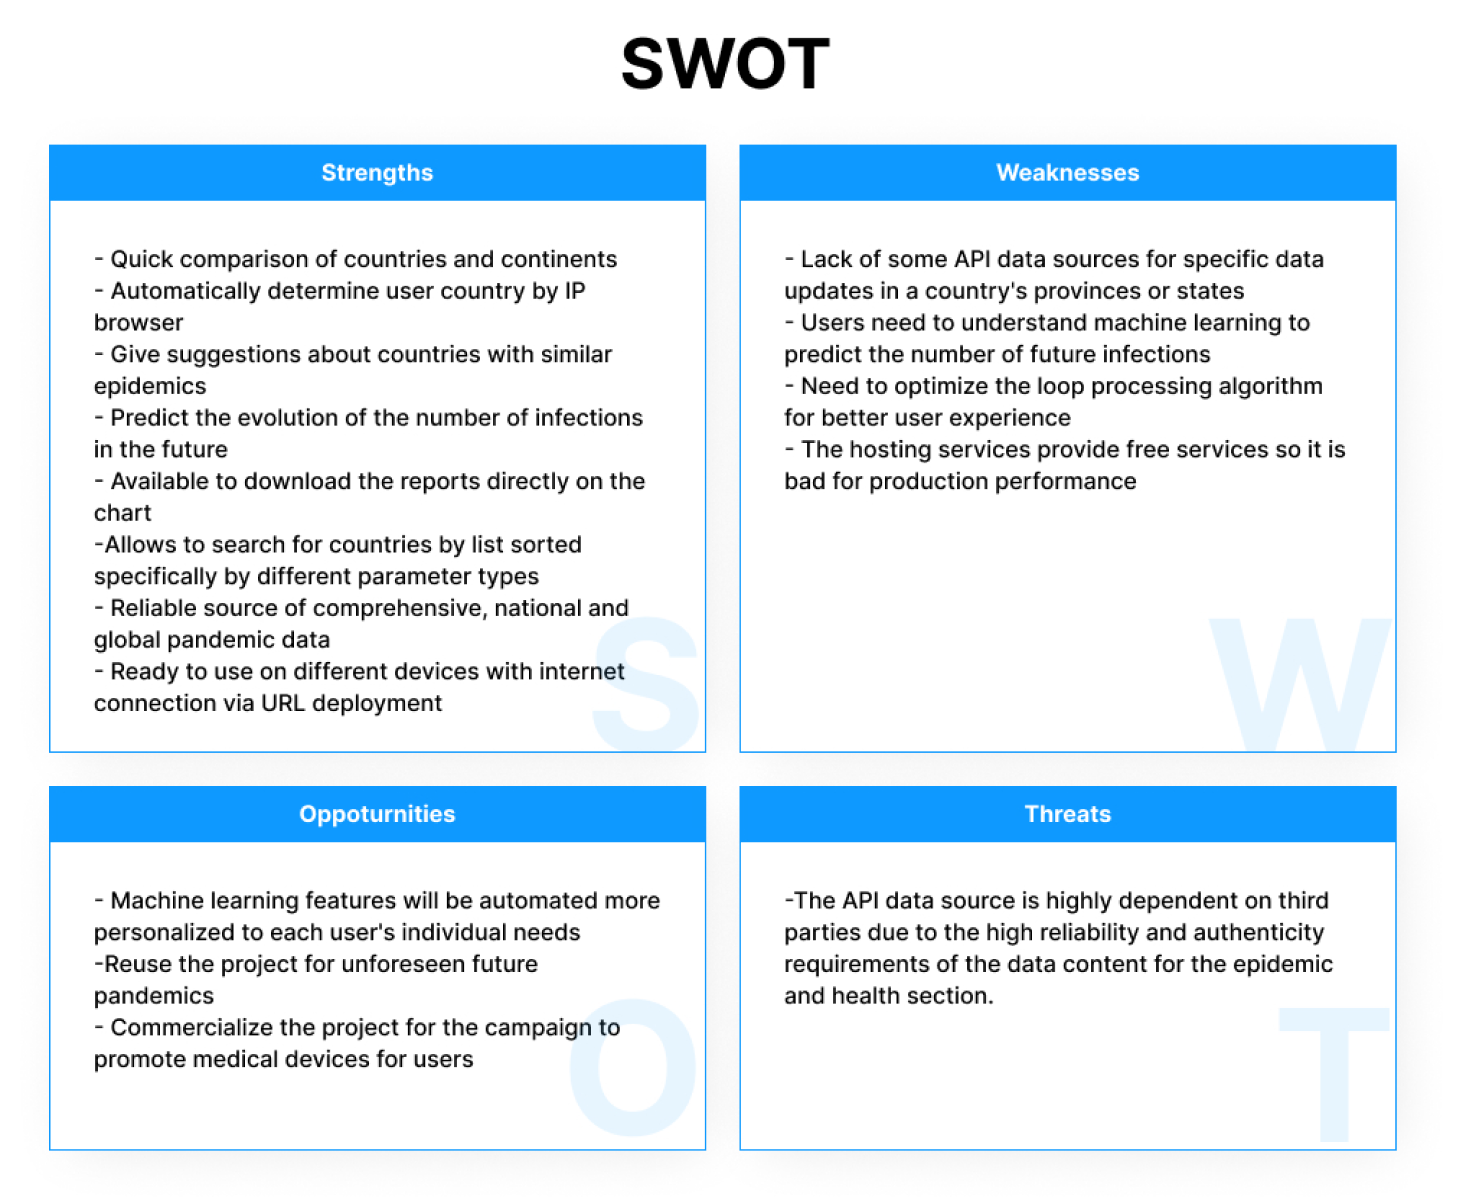
SWOT Analysis
-
Applied Machine Learning algorithms: Regression , K-means for solving real-life problems.
-
Knowledge about types of chart for data Visualization.
-
Work with JS Asynchronous & Lifecycle Hooks, when dealing with APIs.
-
Implement Data processing for different features with Vue Framework, JavaScript.
-
A useful preparation tool for any upcoming pandemics due to modularization and File organization.
-
Basically solved the shortcomings of the the current applications, but still need to iterate for a better version.
-
Increase user reach for commercialization of advertising purposes.